


If your calendar isn’t the core of your 10to8 account, you’re probably missing out! That sounds...
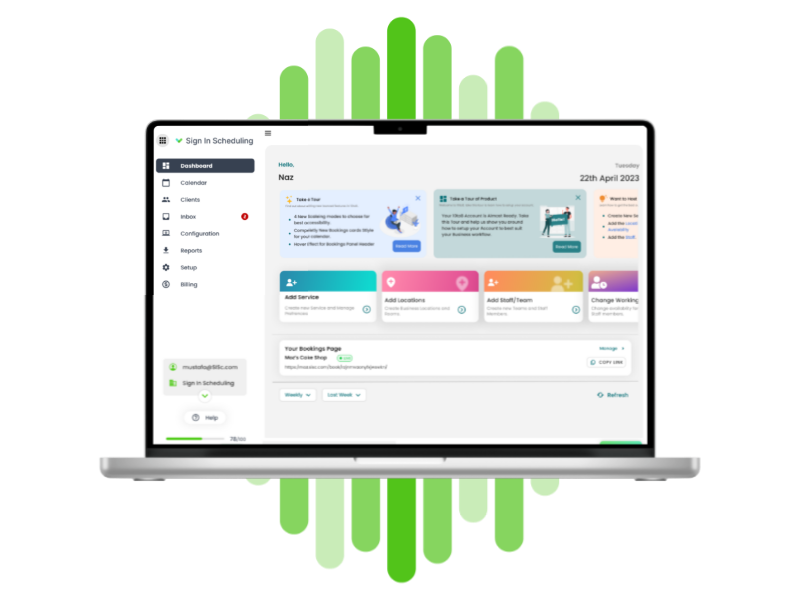
Have you ever wanted an overview of how your organization is performing with 10to8 appointment scheduling software? With your new dashboard, you can easily get it!
It’ll help you identify gaps and opportunities in your appointment management process, thereby enabling you to make strategic decisions for your business. It’ll also keep you up to date with how 10to8 is working for you behind the scenes.
So, let’s go for a deep dive into the functionality of the dashboard, exploring everything it has to offer, and how you can use it to improve how you manage appointments.
What does the new dashboard contain?
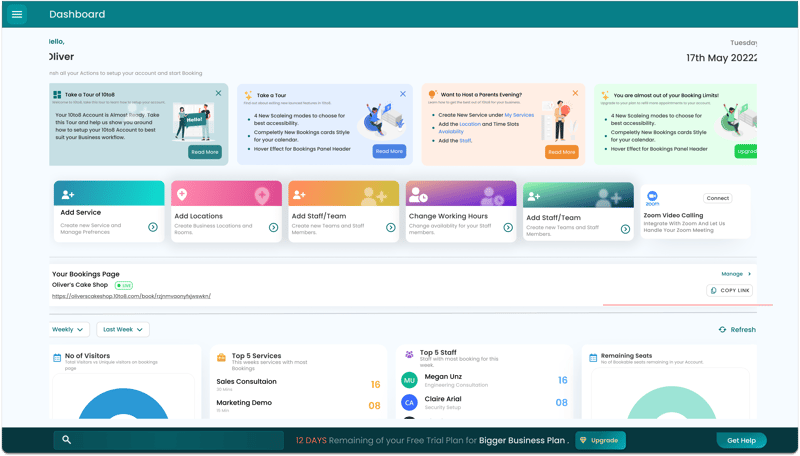
The very top of the new dashboard will provide you with that much-needed insight into what’s new at 10to8. Here’s where we’ll be showing our latest product updates, upcoming webinars, new blog articles, and much more.
However, the most exciting element of the new dashboard is real-time reporting. This will give you a snapshot of your account for any given week, and provide real-time metrics to help you monitor and improve your business.
So what are these reporting metrics?
Your top 5’s
These include your top 5 staff members, top services, and top locations.
Top 5 Staff Members:
This table shows the number of bookings taken by your top 5 staff members. This is incredibly useful, for instance, if you find that a certain staff member is taking significantly more bookings than another, you might rearrange your services to take some pressure off that employee.
Top 5 Services:
This is a breakdown by specific service. Updated every couple of hours, it lets you view your business’s most booked services. It’ll help you optimize your services based on how popular they are. For instance, you could increase the price for highly in-demand services and offer discounts on others to boost them. You could also train and allocate more staff members to popular services to leverage them further.
Top Locations:
This is a location-specific breakdown to glance at the most frequently booked locations in your business. With location insights, you can make decisions about inventory, staffing, and expansion. If you provide online services and see an increased demand for them, you could consider shutting down one of your office locations to reduce operational costs. This can have a direct impact on the revenue of your business and make the life of your accountants easier.
The top 5’s can be a good way of looking at which areas of your business are doing really well and which areas might need changing.
No-shows and bookings per day
The largest card on the dashboard is a graph that shows how many bookings you've taken each day, highlighting cancellations and no-shows.
With this, you can see at a glance which of your days are the busiest. You can quickly see how many no-shows you’ve had that week and how many appointments have been cancelled. Each of these sections is colour-coded to make it easier to view.
Weekly statistics
The statistics and reporting cards give you key insights that you can use to monitor the growth of your business:
- Bookings you’ve taken per week
- Bookings by all your staff per week
- Weekly customers bookings
- Appointment no-shows
- The percentage of time you have free for bookings
- The average customer wait time
- New weekly customers you’ve gained
- Overall visits to your booking page
- Unique visits to your booking page
- Reminders to be sent per week
- Weekly messages sent
- Weekly Zoom meetings
- The overall value of payments you’ve taken this week
- Your average satisfaction score.
These insights will tell you a lot about your business. For instance, perhaps you’re aiming to have the majority of appointments booked directly by customers but you can see that most are still booked by staff. In this case, you can start sharing your booking page via email campaigns, and social media. Regularly monitoring views on your online booking page can help you predict the number of bookings you might get during certain weeks and seasons.
Likewise, If you know what percentage of staff time remains unbooked, you can start allocating that time elsewhere so it doesn’t end up wasted. And, if you easily can see your average satisfaction score, then you know if your company is doing a good job, or if there are some things that could be improved.
Dashboard settings
Finally, there are several ways that you can toggle what you view on the dashboard even further. This makes it even more customizable to your specific needs.
Customize your dashboard to get insights
At the top of the dashboard, you’ll find two drop-down menus. The first one will allow you to filter what you see over a 3-week period – this week, last week, or next week.
Comparing your statistics for the current week with what you took previously will show you if your performance has improved or perhaps even decreased slightly. You can also look into next week and see how your bookings compare, and which services are taking the most appointments.
This is perfect for noticing trends in your business. Perhaps you always get busier towards the beginning of the month and appointments taper off towards the end. Perhaps you always have a busy spike on a Wednesday and want to work on boosting your appointment volume over the entire week instead. Viewing this in advance also means you can prepare accordingly and avoid any busy surprises.
The second drop-down allows you to filter by staff members. You can select a certain staff member and see their top bookings per week, how many messages they’ve sent, how many Zoom meetings they’ve had and much more. An easy way to gain a quick overview of a particular staff member’s performance.
Get the latest figures with real-time reporting
Your new dashboard enables you to run real-time reports. The stats on the page refresh automatically every 2 hours. But, if you catch them in the middle of this cycle, hit the refresh button on the right side to get the latest figures.
See how your business is performing this week versus last week
Finally, at the bottom of each of the statistics blocks, there is a little time stamp, showing you when this figure was last updated. There’s also a percentage arrow next to the time stamp that shows you how much this figure has changed since last week and whether it’s been a positive or negative change.
Overall…
The new product dashboard is a great way to view your business at a glance. The interface is packed with insightful metrics showing how your business, services, and staff are doing. It allows you to evaluate, adjust, and prepare for things accordingly – incredibly useful for anyone who wants to stay on top of their game and closely monitor their business performance.


Blog comments